Temporal and localized comparison of measurements
Compare measurements taken at different stations or over different periods of time, and go beyond strict river management.

Our customers
Water network supervision in just a few clicks
Features
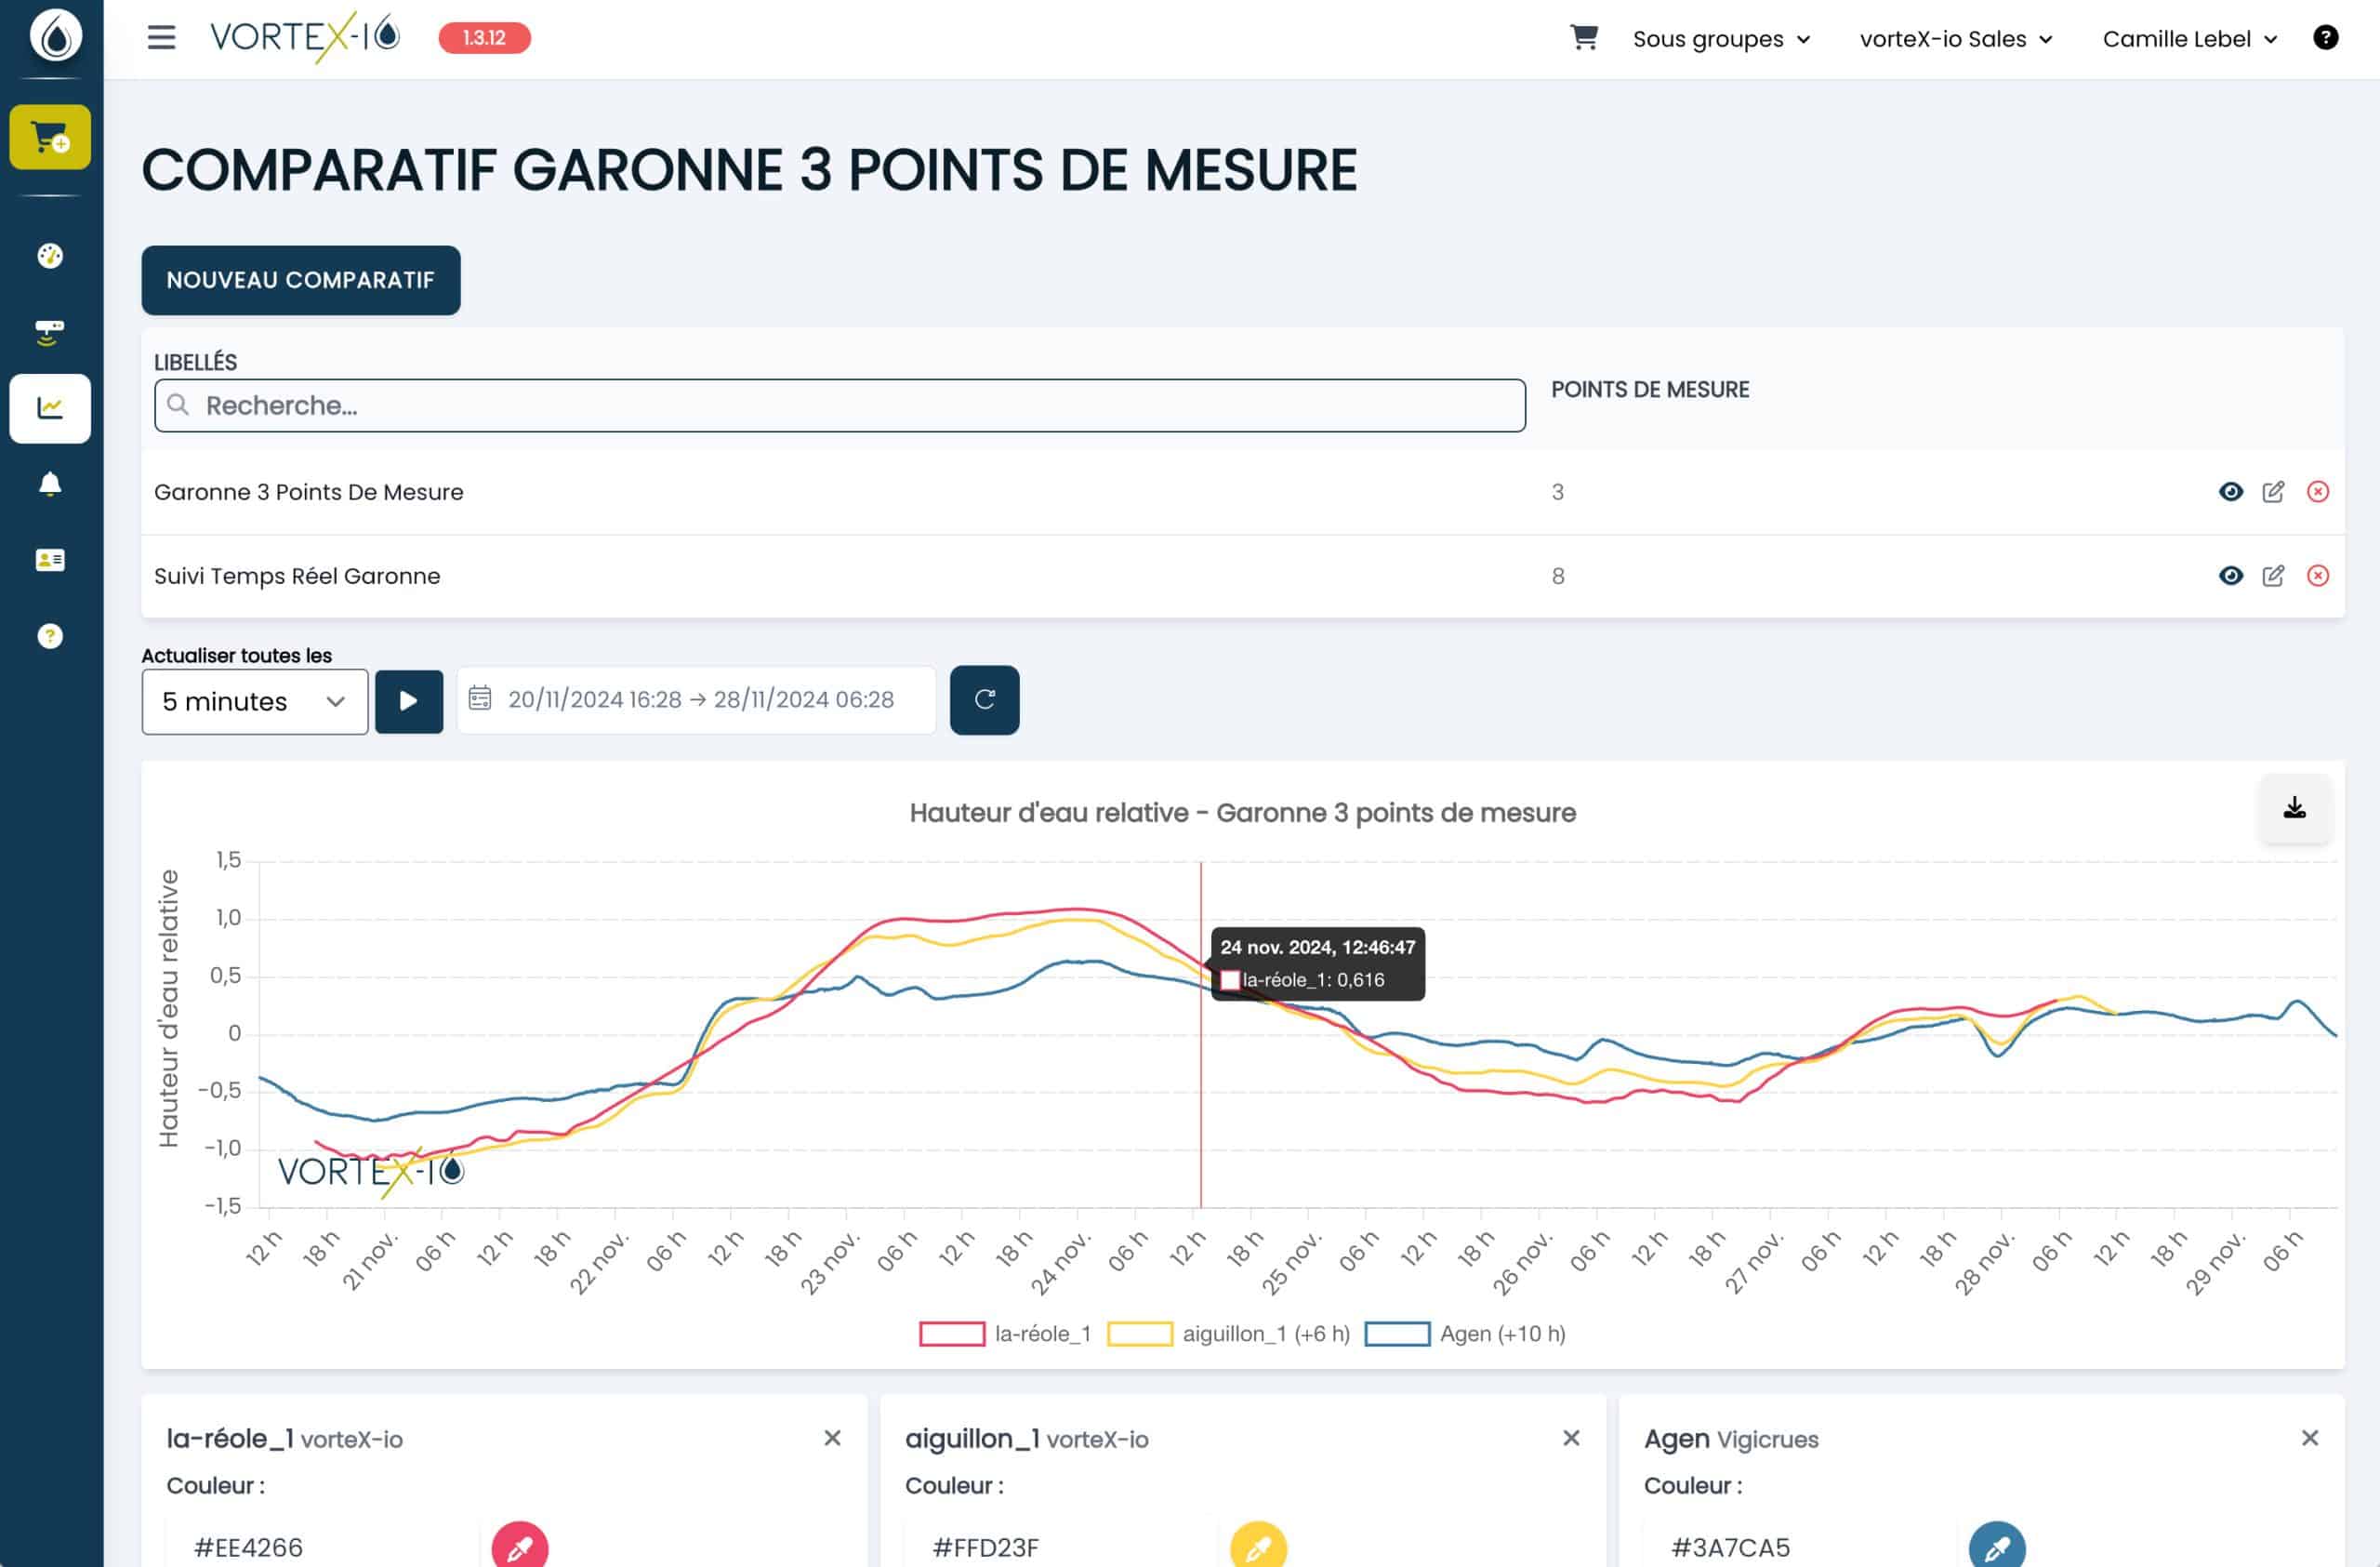
Analyze changes in watercourses over time and space
Easily display multiple monitoring curves on a single graph. Visualize, compare and analyze your watercourse parameters at a glance.
Compare different stations
Water height, rate of rise, surface temperature, flow rate
Combine several measurement networks
vorteX-io network, state networks, data from your own sensors
Analyze the evolution of a measuring point over time
Highlighting trends or anomalies and identifying seasonal or one-off events

Benefits
Supervision of your water system
Monitoring and management of your watercourses on a changing scale: compare your hydrological data in space and time
Monitoring flood wave propagation
Anticipate potential impacts on flood zones
Measuring the effectiveness of your actions
Visualize before-and-after dynamics
Improving hydrological models
Compare your results with in situ measurements in real time
Create your account and get started now
Join the community of vorteX-io users and try out our services without delay (and without a credit card).

An indispensable tool for understanding watercourses
Understanding the evolution of watercourses means predicting the severity of a flood, optimizing your response to the risk and anticipating tomorrow’s changes.
Flood anticipation
Estimate the height of water expected at each point along the river and the speed of the flood wave.
DiscoverLow-water regulation
Compare the current water level with previous periods to take preventive action.
DiscoverPreserving aquatic environments
Measure the effectiveness of your actions and compare them with your analyses of the state of aquatic environments.
Discover